The video resource "The Shape of Data: Distributions: Crash Course Statistics #7" …
The video resource "The Shape of Data: Distributions: Crash Course Statistics #7" is included in the "Statistics" course from the resources series of "Crash Course". Crash Course is a educational video series from John and Hank Green.
Significant Statistics: An Introduction to Statistics is intended for the one-semester introduction …
Significant Statistics: An Introduction to Statistics is intended for the one-semester introduction to statistics course for students who are not mathematics or engineering majors. It focuses on the interpretation of statistical results, especially in real world settings, and assumes that students have an understanding of intermediate algebra. In addition to end of section practice and homework sets, examples of each topic are explained step-by-step throughout the text and followed by a 'Your Turn' problem that is designed as extra practice for students.
Simulation by Peter Collingridge giving us a better understanding of why we …
Simulation by Peter Collingridge giving us a better understanding of why we divide by (n-1) when calculating the unbiased sample variance. Simulation available at: http://www.khanacademy.org/cs/challenge-unbiased-estimate-of-population-variance/1169428428
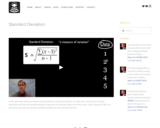
In this video Paul Andersen explains the importance of standard deviation. He …
In this video Paul Andersen explains the importance of standard deviation. He starts with a discussion of normal distribution and how the standard deviation measures the average distance from the mean, or the "spread" of data. He then shows you how to calculate standard deviation by hand using the formula.
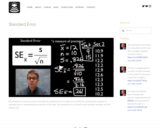
Paul Andersen shows you how to calculate the standard error of a …
Paul Andersen shows you how to calculate the standard error of a data set. He starts by explaining the purpose of standard error in representing the precision of the data. The standard error is based on the standard deviation and the sample size.
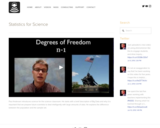
Paul Andersen introduces science for the science classroom. He starts with a …
Paul Andersen introduces science for the science classroom. He starts with a brief description of Big Data and why it is important that we prepare future scientists to deal intelligently with large amounts of data. He explains the difference between the population and the sample set.
The lectures are at a beginning graduate level and assume only basic …
The lectures are at a beginning graduate level and assume only basic familiarity with Functional Analysis and Probability Theory. Topics covered include: Random variables in Banach spaces: Gaussian random variables, contraction principles, Kahane-Khintchine inequality, Anderson’s inequality. Stochastic integration in Banach spaces I: γ-Radonifying operators, γ-boundedness, Brownian motion, Wiener stochastic integral. Stochastic evolution equations I: Linear stochastic evolution equations: existence and uniqueness, Hölder regularity. Stochastic integral in Banach spaces II: UMD spaces, decoupling inequalities, Itô stochastic integral. Stochastic evolution equations II: Nonlinear stochastic evolution equations: existence and uniqueness, Hölder regularity.
In order to promote students’ conceptual understanding and learning experience in introductory …
In order to promote students’ conceptual understanding and learning experience in introductory statistics, a technology task, which focuses on the probability distribution in which means are defined, was created using TinkerPlots, an exploratory data analysis and modeling software. The targeted audiences range from senior high school grade levels to college freshmen who are starting their introductory course in statistics. Students will be guided to explore and discover the movement behaviors of means of a set of numbers randomly generated from a fixed range of values characterized by a predetermined probability distribution. The cognitive, mathematical, technological and pedagogical natures of the task, as well as its association with the statistics education framework based on the Guidelines for Assessment and Instruction in Statistics Education (GAISE) by the American Statistical Association, will be elaborated. A brief discussion on what cognitive design principles this task satisfies will also be provided at the end.
Intended for those without a background in statistics, this work is an …
Intended for those without a background in statistics, this work is an explanation of the quantitative processes used by researchers to try to establish whether one variable has an impact on another. The concept of concomitant variation, two variable types (independent and dependent), the three basic levels of measurement (nominal, ordinal & numerical), and four statistical tests of relationships (Chi-Square, ANOVA, Logistical Regression and Correlation) are described within. These descriptions do not require quantitative skills in order to be understood.
This course covers the basic algebra and technological tools used in the …
This course covers the basic algebra and technological tools used in the social, physical and life sciences to analyze quantitative information. The emphasis is on real world, open-ended problems that involve reading, writing, calculating, synthesizing, and clearly reporting results. Topics include descriptive statistics, linear, and exponential models. Technology used in the course includes computers (spreadsheets, Internet) and graphing calculators.
No restrictions on your remixing, redistributing, or making derivative works. Give credit to the author, as required.
Your remixing, redistributing, or making derivatives works comes with some restrictions, including how it is shared.
Your redistributing comes with some restrictions. Do not remix or make derivative works.
Most restrictive license type. Prohibits most uses, sharing, and any changes.
Copyrighted materials, available under Fair Use and the TEACH Act for US-based educators, or other custom arrangements. Go to the resource provider to see their individual restrictions.