This learning object walks the student through a quadratic variation problem.
- Subject:
- Mathematics
- Numerical analysis
- Probability
- Trigonometry
- Date Added:
- 10/15/2010

This learning object walks the student through a quadratic variation problem.
Users study a chart containing numbers 1 to 99 and look for trivial palindromes as well as double and triple iteration palindromes. The reverse and add technique is demonstrated.
In this interactive object, learners follow step-by-step instructions for reducing algebraic fractions, which contain addition and/or subtraction, to their simplest form. This activity has audio content.
In this highly interactive and animated object, learners follow a step-by-step process to reduce algebraic fractions, which contain no addition or subtraction, to their simplest, most elementary form. Immediate feedback is provided. This activity has audio content.
In this animated activity, learners listen to instructions for simplifying a complex fraction by finding the least common denominator. This learning object requires a computer that is equipped with speakers.
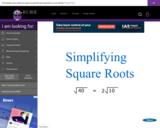
The student simplifies square roots involving the product of a numeric and variable term.

In this interactive object, learners follow step-by-step instructions for reducing algebraic fractions so that they can then be multiplied. This activity has audio content.

Learners use the lowest common denominator to simplify and then solve equations with algebraic fractions. Immediate feedback is provided. This animated object has audio content.
Learners read about the different uses of the word "data." They will test themselves on examples of data that is singular, plural, qualitative, quantitative, nominal, ordinal, interval, rational, discrete, or continuous.

Students learn to create a stem and leaf plot. They view an example and then create one themselves.

The learner identifies and calculates the area under the normal curve specified by given z-scores.

Learners read a definition of "normal distribution." In an interactive exercise, they enter values for the mean and the standard deviation of normally distributed data and observe the resulting changes in the shape of the normal curve.

Students use the Empirical Rule to calculate the percentages of data between two data points. They also calculate the values corresponding to the given percentages of the data.

Learners are given z scores and asked to calculate and enter the numeric value of an area.

In this activity you can manipulate the supply, demand, ceiling, and floor and reveal the equilibrium price and reveal the equilibrium price and quantity.
Learners follow the steps required to construct an ungrouped frequency distribution using either manual methods or a spreadsheet.

This lesson provides an explanation and practice using the unity fraction method of doing measurement and rate conversions. It also can be applied to problems of angular and linear velocity.
This learning object gives a description of direct, inverse, joint, quadratic, and combined variation, and walks the student through a problem of each type. The students learn to create the correct formula from the given problem as well as to solve it. There are also technical application problems given at the end for more practice.

This learning object walks the student through two application problems.
The learner places given vectors in correct positions on the Cartesian coordinate system. The vectors contain both positive and negative magnitude and direction.